Treasury market recap: 2-, 5-, and 10-year yields fell as policy risk and geopolitics met mixed inflation signals
U.S. Treasury yields moved lower across the curve this past week, with the biggest moves concentrated in the intermediate maturities that tend to reflect both growth expectations and the expected path of Federal Reserve policy. By Friday’s close (February 27, 2026), the 2-year, 5-year, and 10-year all finished below where they started on Monday (February 23, 2026), even as inflation headlines stayed noisy.
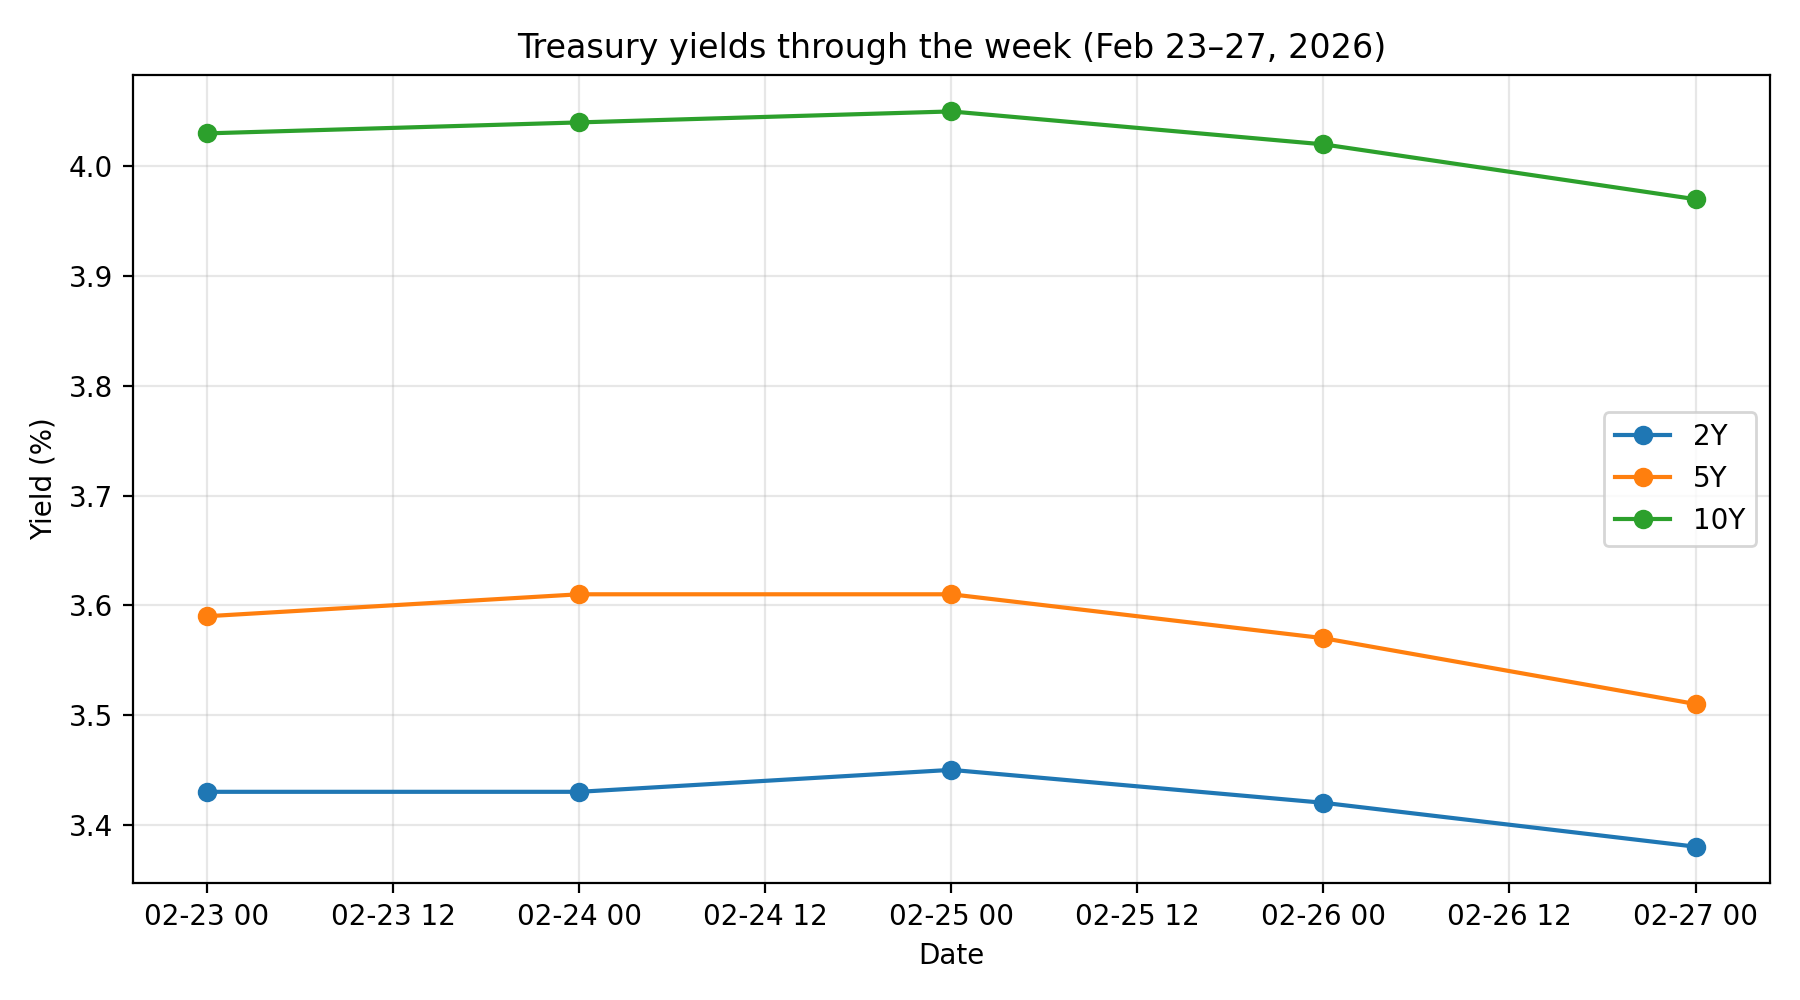
Using the U.S. Treasury’s constant maturity (par yield curve) data, the 2-year yield fell from 3.43% on Feb. 23 to 3.38% on Feb. 27. The 5-year fell from 3.59% to 3.51%. The 10-year fell from 4.03% to 3.97%.
What actually happened to yields this week
The week’s big picture: rates drifted lower with a mild “bull flattening” in the belly early, then a broader rally into Friday.
- 2-year (policy sensitive): 3.43% → 3.38% (down 5 bps)
- 5-year (growth plus policy): 3.59% → 3.51% (down 8 bps)
- 10-year (growth, inflation premium, risk sentiment): 4.03% → 3.97% (down 6 bps)
This matters because the 2-year tends to track where markets think the Fed funds rate is headed, while the 5-year and 10-year incorporate both policy expectations and broader growth and risk sentiment.
Why yields moved: tariffs, geopolitics, and a hot PPI that did not stop the rally
1) Policy uncertainty on tariffs kept “risk” markets jumpy.
A major driver early in the week was renewed uncertainty around tariffs after the U.S. Supreme Court struck down a large swath of Trump-era global tariffs tied to emergency powers, and the administration signaled alternate tariff paths (including Section 122 discussions). That sort of policy volatility often pushes investors toward Treasuries as a defensive asset, pressuring yields lower.
2) Geopolitical tensions added a classic risk-off bid.
Headlines around U.S.-Iran tensions (and related oil market concerns) helped keep safe-haven demand elevated. Risk-off flows typically compress longer yields as investors pay up for duration.
3) Inflation signals were hotter, but the bond market looked through them.
Friday’s inflation impulse came from the Producer Price Index: final demand up 0.5% m/m and 2.9% y/y in January, with a notable services contribution, per BLS. Normally, hotter inflation pushes yields higher. But yields still fell into week-end, which is consistent with “growth scare” or risk-off behavior dominating the tape.
4) Growth data stayed in the background, but the “direction” was softer than late 2025.
The BEA’s latest GDP release showed Q4 2025 real GDP at 1.4% (annual rate), down meaningfully from Q3’s 4.4%. That kind of deceleration can reinforce the market’s willingness to buy duration on bad news, especially when the market is already sensitive to policy shocks.
5) Durable goods added to the “slowing momentum” narrative.
Advance durable goods orders for December 2025 fell 1.4% m/m, per the Census Bureau’s advance report coverage. Even though it is backward-looking, it fit the broader theme that growth is not accelerating.
What the yield curve shift says about market expectations
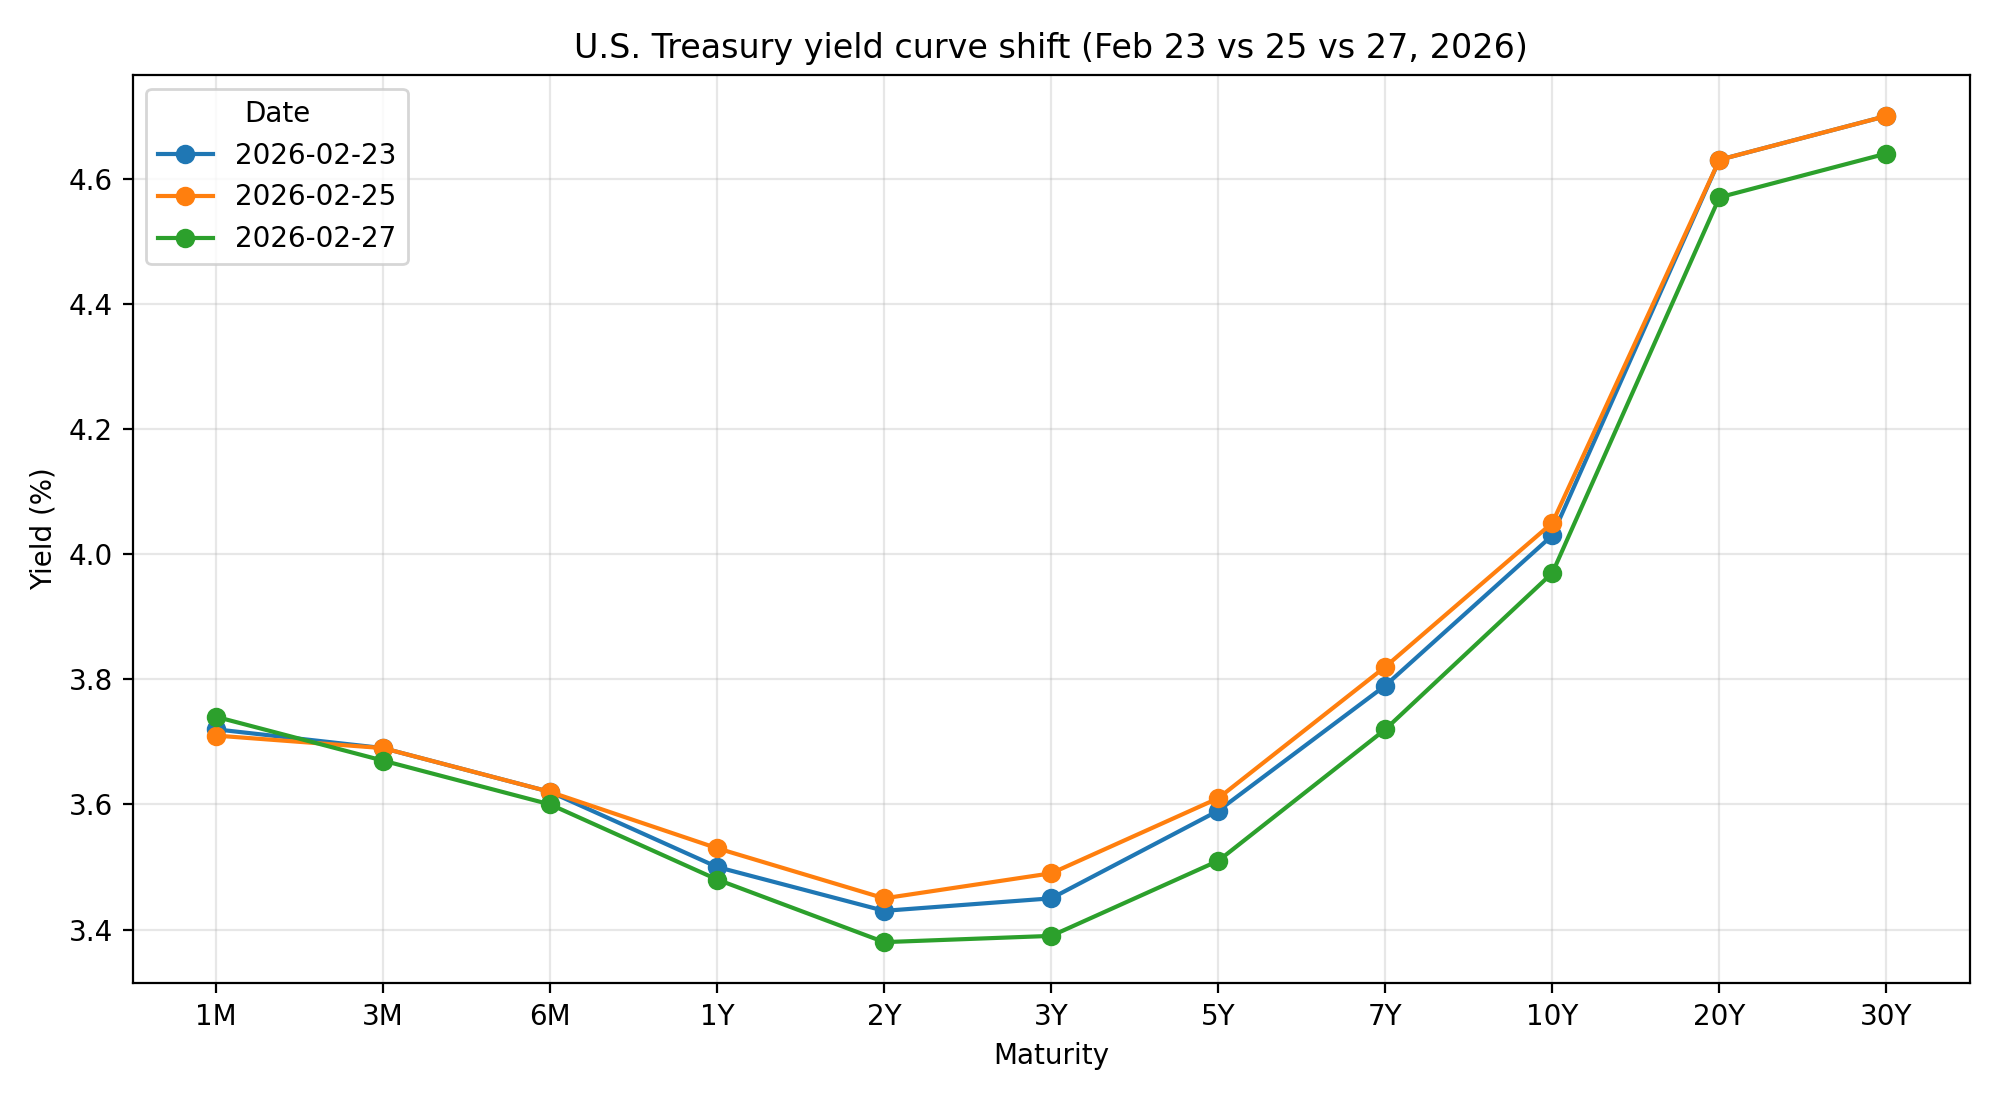
Comparing Monday to Friday, the curve moved down across most tenors, with the intermediate sector (2 to 10 years) leading. That profile is consistent with two things happening simultaneously:
- Markets pricing a slightly easier Fed path (pulling down the 2-year), and
- A defensive bid for duration amid geopolitical and policy uncertainty (pulling down the 5-year and 10-year).
What could move 2-, 5-, and 10-year yields next week (March 2 to March 6)
Next week’s setup is straightforward: the market gets a fresh read on labor momentum and business activity, plus scheduled Treasury auctions that can matter at the margin.
Key economic catalysts
- ISM manufacturing and services surveys (watch employment and prices paid components).
- ADP private payrolls midweek as positioning into jobs data develops.
- February jobs report (Nonfarm Payrolls) on Friday. This is the biggest potential mover for the 2-year and 5-year because it can change the “how soon does the Fed cut” narrative quickly.
Policy and geopolitical overhangs
- Any further clarity (or escalation) around tariff policy mechanics could swing risk sentiment quickly, which tends to show up most clearly in the 5-year and 10-year.
- Continued Middle East tension could keep a floor under safe-haven demand even if data is firm.
Supply (Treasury auctions)
- The Treasury’s upcoming auctions calendar is always worth monitoring, especially if volatility stays elevated.
Quick takeaway for investors and business owners
This was a week where Treasuries traded more like a “risk barometer” than a pure inflation instrument. Despite a hot PPI print, yields fell, suggesting the market was more focused on downside growth risks, policy uncertainty, and geopolitics. Next week’s labor and ISM data can challenge that view quickly. If jobs and surveys re-accelerate, the 2-year can pop first. If uncertainty stays dominant, the 10-year can stay heavy-bid.
This material has been distributed for informational purposes only and should not be considered as investment advice or a recommendation of any particular security, strategy or investment product. Information contained herein has been obtained from sources believed to be reliable, but not guaranteed. No part of this material may be reproduced in any form, or referred to in any other publication, without express written permission. ©2026 MIXED MARKET ARTIST
(Visit Fin Pro Marketing – The Best Marketing for Finance Professionals)