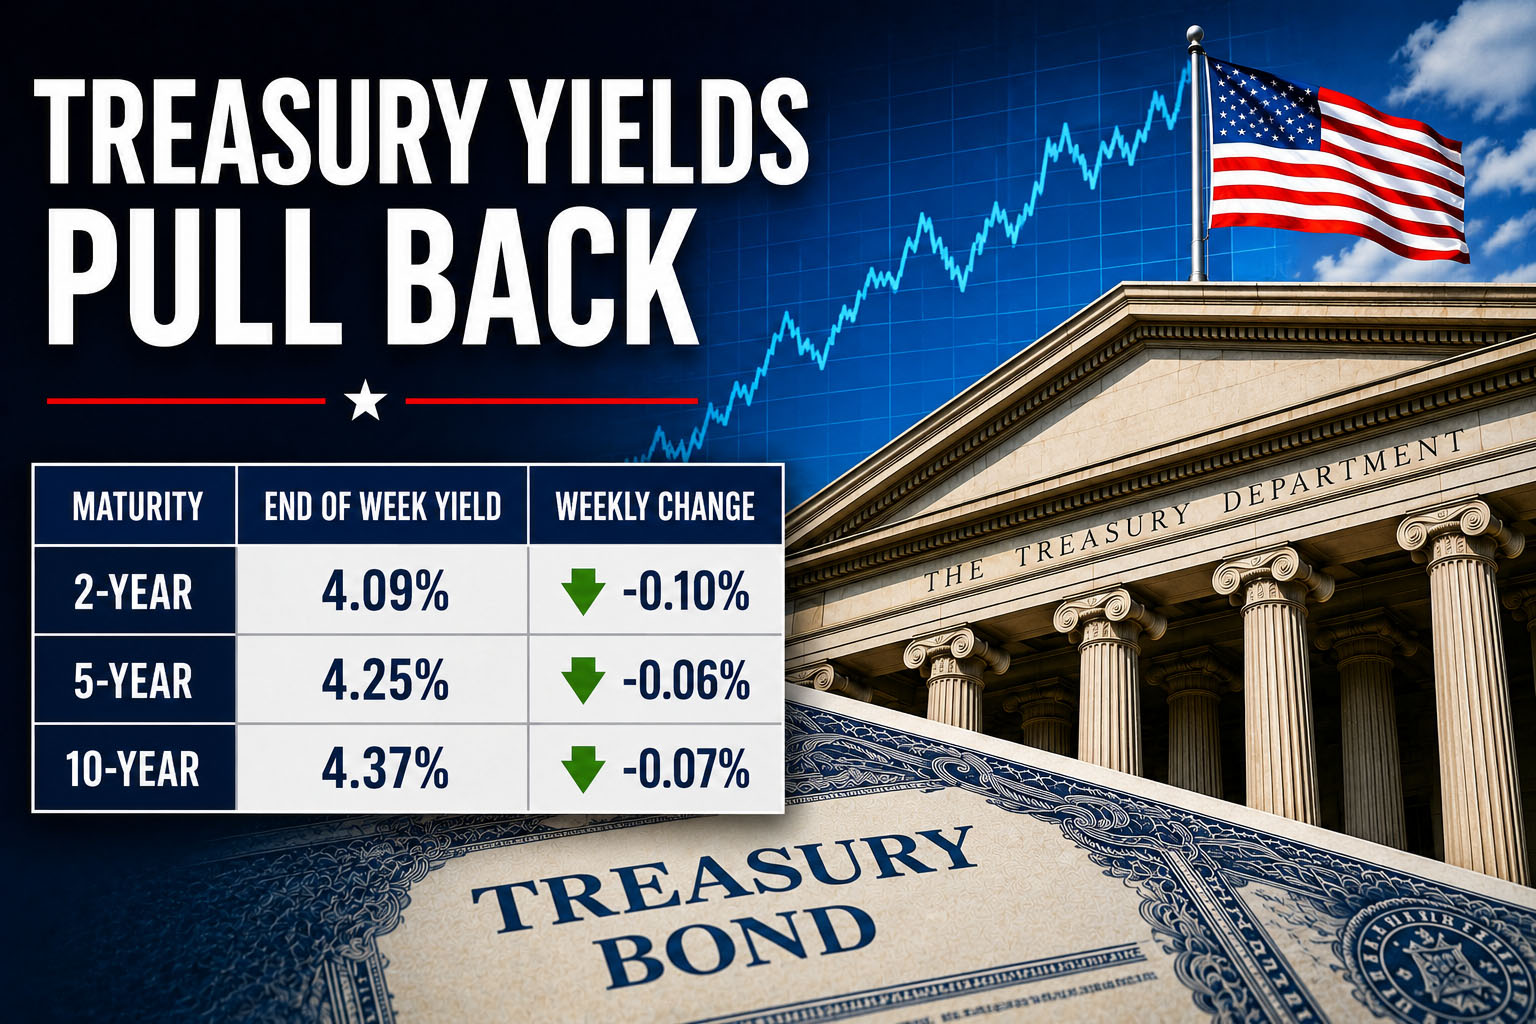
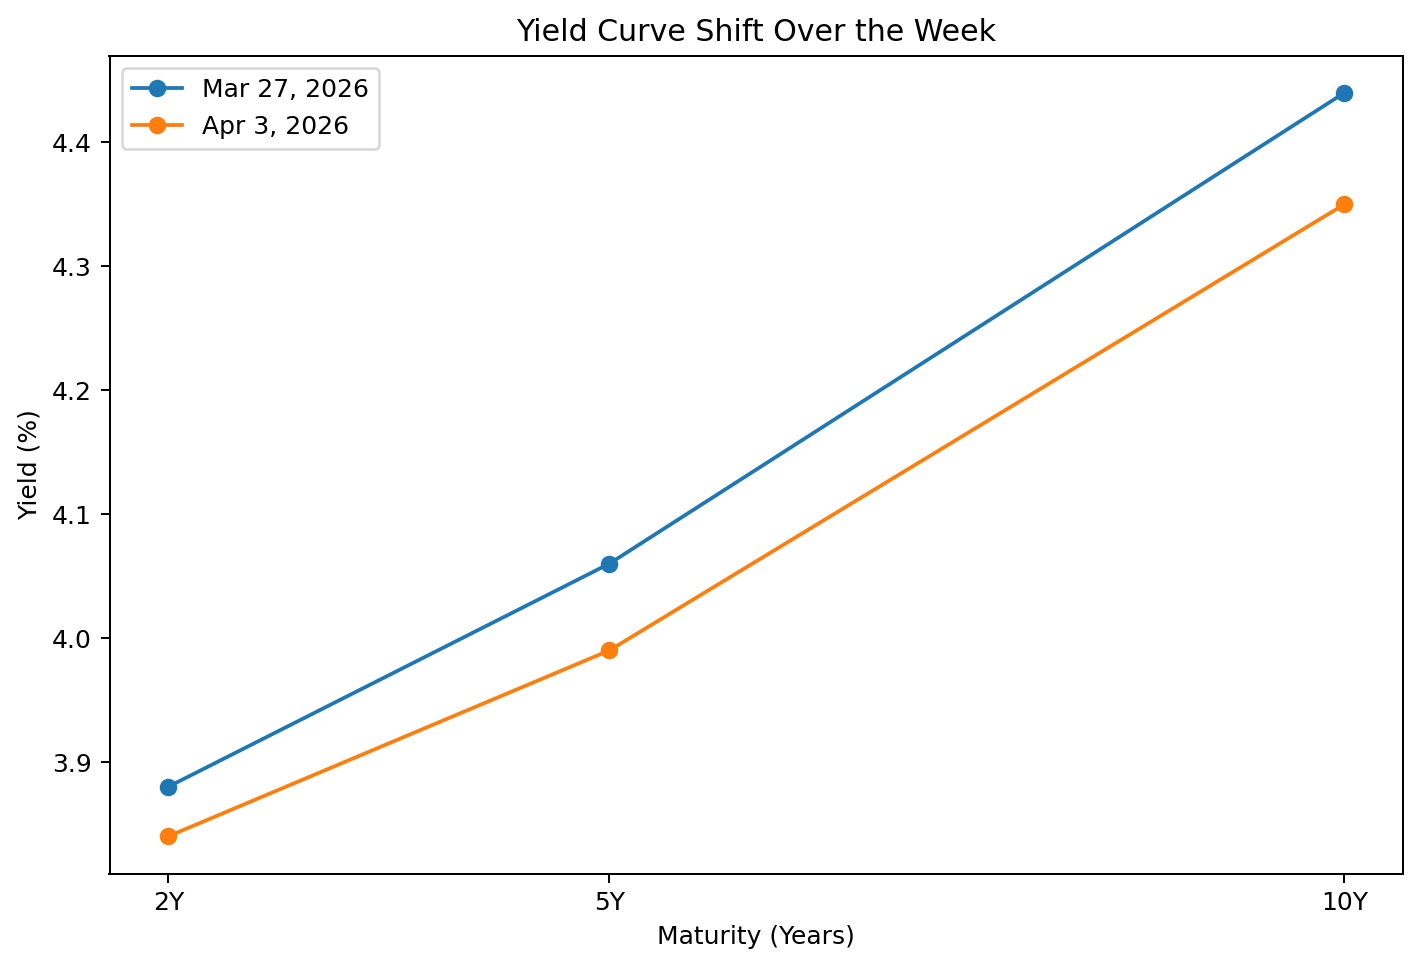
2-Year, 5-Year, and 10-Year Treasury Yields Moved Lower on the Week, but the Path Was Volatile
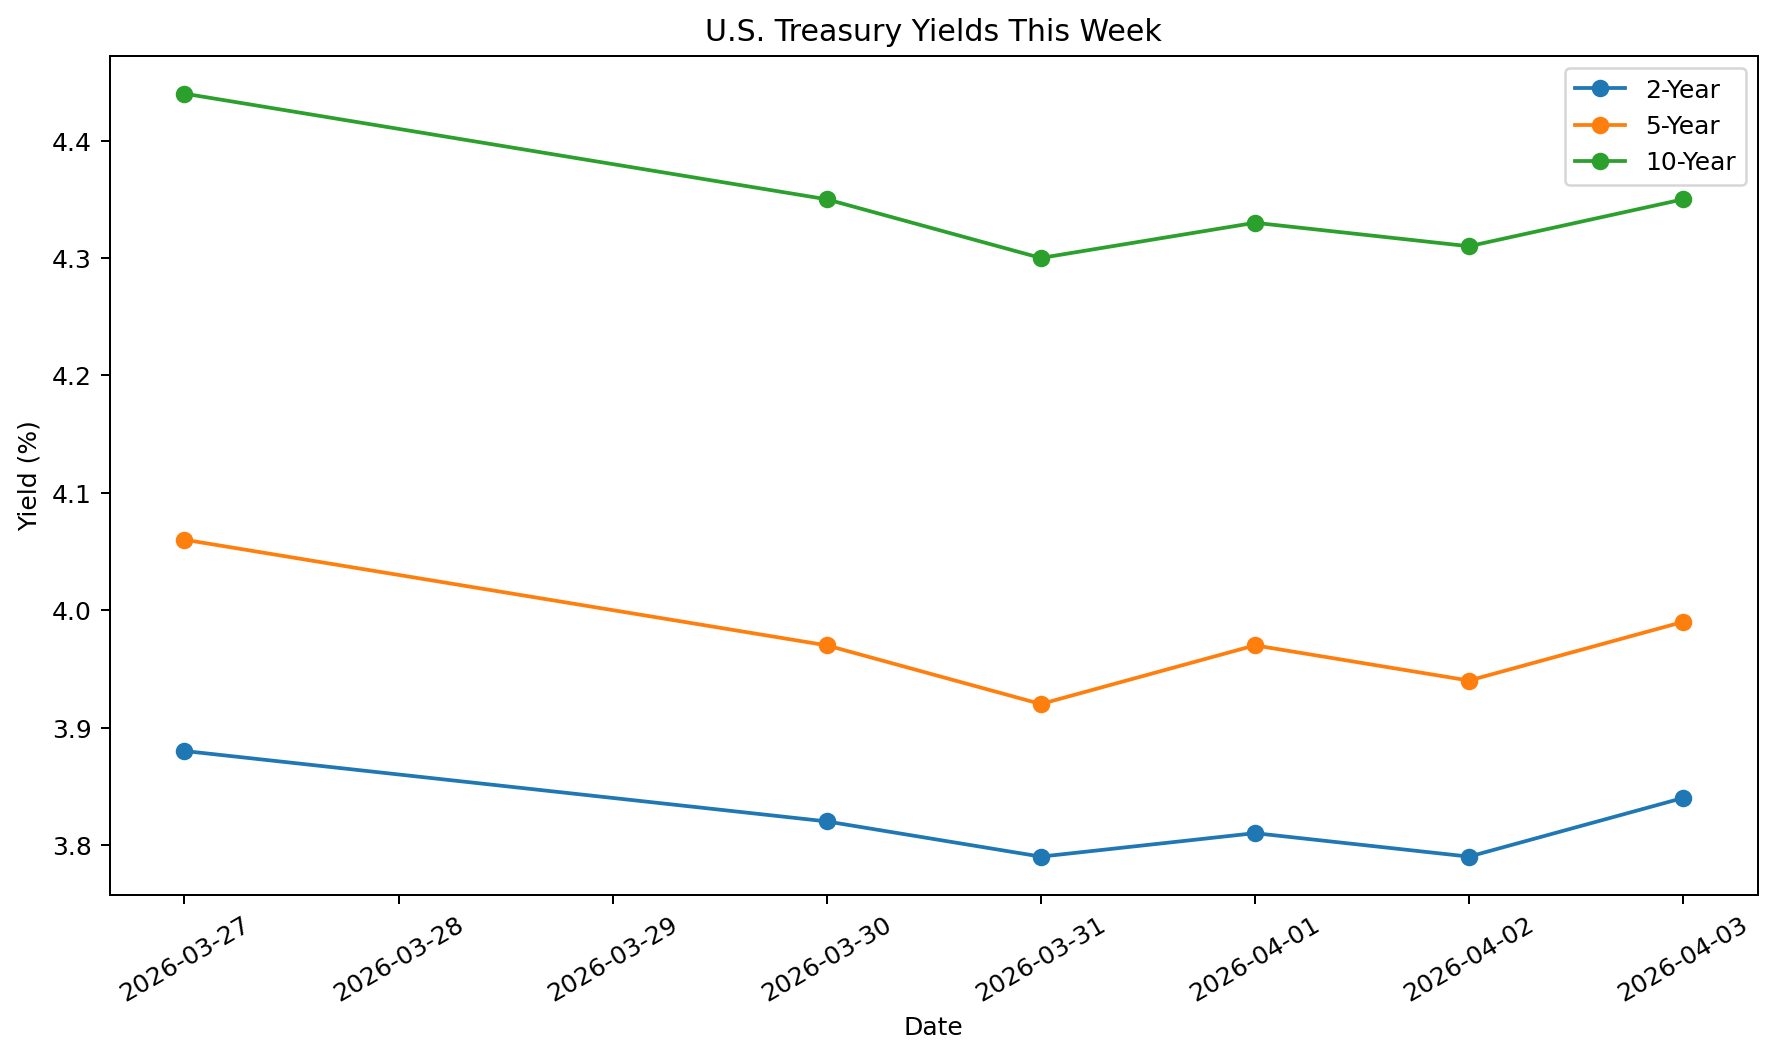
U.S. Treasury yields finished the week of March 27 to April 3 lower than where they started, but the move was anything but calm. Using the Treasury/Fed constant-maturity series, the 2-year yield moved from 3.88% on March 27 to 3.84% on April 3, the 5-year moved from 4.06% to 3.99%, and the 10-year moved from 4.44% to 4.35%. That left the curve a bit flatter by week’s end, with the 10-year minus 2-year spread narrowing from about 56 basis points to about 51 basis points.
The broad backdrop remained dominated by the Middle East shock. Reuters reported that inflation risks had already pushed Treasury yields higher after the U.S.-Iran conflict ignited energy prices, while later intelligence reporting suggested Iran was unlikely to ease its grip on the Strait of Hormuz soon. That mattered for rates because the bond market has been forced to price both higher inflation risk and the possibility that the growth hit from expensive energy eventually pulls yields back down.
What happened during the week
The week opened with a sharp bond rally. On Monday, March 30, the 10-year yield dropped to about 4.35% from 4.44% the prior Friday, one of the biggest one-day declines in months. Quarter-end and month-end rebalancing helped drive demand for Treasurys, and some investors judged that the prior selloff tied to oil and war-related inflation fears had gone too far. By that point, the 2-year had eased to 3.82% and the 5-year to 3.97%.
Tuesday brought another crosscurrent. Reuters reported that consumer confidence improved modestly in March, but job openings fell to 6.882 million and hiring dropped to a six-year low outside the pandemic period. That kind of data can support Treasurys because it points to a labor market that is softer beneath the surface, even if recession has not arrived. The market seemed to reflect that balance, with the 2-year at 3.79%, the 5-year at 3.92%, and the 10-year at 4.30% on March 31.
On Wednesday, April 1, the market digested stronger growth signals but also uglier inflation signals. Reuters reported that U.S. manufacturing expanded in March while supplier delivery performance deteriorated, and the ISM prices component jumped as war-related supply disruptions fed through to input costs. Retail sales for February also rose 0.6%, suggesting spending had held up before the latest energy shock fully hit households. Yields nudged back up, with the 2-year at 3.81%, the 5-year at 3.97%, and the 10-year at 4.33%.
Thursday’s tone was shaped by hopes that the geopolitical situation might not worsen immediately. Barron’s noted that optimism about possible de-escalation in the Middle East helped pull yields lower in trading, especially at the front end. By April 2, the 2-year was 3.79%, the 5-year 3.94%, and the 10-year 4.31%.
Then Friday pushed yields back higher again. The March employment report showed nonfarm payrolls rising by 178,000 and unemployment at 4.3%, according to the Bureau of Labor Statistics. Reuters said the stronger-than-expected report likely keeps the Fed on the sidelines for now, and market coverage showed Treasury yields ticking up after the release. Treasury’s April 3 daily CMT snapshot showed the 2-year at 3.84%, the 5-year at 3.99%, and the 10-year at 4.35%.
How the move looked across the curve
The 2-year remained the cleanest read on shifting Fed expectations. It fell early in the week as traders reconsidered whether the energy shock would choke growth enough to offset inflation pressure, then bounced Friday after the jobs report reminded markets that the economy still has some near-term resilience. The fact that it ended only slightly below the prior Friday tells you the market is not ready to price aggressive easing.
The 5-year stayed in the middle of the tug-of-war. It came down more than the 2-year over the week, from 4.06% to 3.99%, which suggests investors backed away a bit from the most extreme inflation scare that had built late in March. But the move was still modest relative to the geopolitical risk in play.
The 10-year told a similar story. It ended the week below the 4.44% level seen on March 27, but it did not break decisively lower. That makes sense in an environment where investors are weighing safe-haven demand and slower growth against persistent oil-driven inflation, fiscal strain, and the possibility that the Fed cannot respond quickly with rate cuts. Reuters also noted growing concern that higher war costs and already-large deficits could become an additional headwind for longer-dated Treasuries.
What could move Treasury yields next week
The biggest scheduled U.S. macro release next week is the March CPI report on Friday, April 10 at 8:30 a.m. ET. The BLS release calendar confirms that date, and it is the first major inflation print likely to capture more of the recent energy shock. If headline inflation comes in hot, the 2-year and 5-year could face renewed upward pressure.
Markets will also watch the FOMC minutes on Wednesday, April 8 at 2:00 p.m. ET. The Fed calendar lists the minutes from the March 17-18 meeting for that day. Investors will be looking for how worried policymakers already were about inflation persistence, growth risks, and the possibility that geopolitical supply shocks complicate the policy path.
Treasury supply will matter too. TreasuryDirect’s upcoming auctions page shows a 3-year note auction on April 7, a reopened 10-year note auction on April 8, and a reopened 30-year bond auction on April 9. Strong auction demand could help stabilize yields, while weak demand would matter most at the long end.
Outside the calendar, the biggest political and geopolitical variable is still the Strait of Hormuz. Reuters reported on April 3 that U.S. intelligence assessed Iran was unlikely to reopen the strait anytime soon, because keeping energy markets under pressure remains a source of leverage. If that view proves right and oil stays elevated, inflation fears could reprice the front and belly of the Treasury curve higher again.
Bottom line
This past week was a good example of why Treasury trading is difficult in a stagflation-style setup. The bond market had to process quarter-end demand, softer labor-market internals, firmer manufacturing and spending data, a stronger headline payroll report, and an ongoing geopolitical shock that is still working through oil, inflation expectations, and fiscal risk. The net result was lower yields on the week, but not a clean rally. The 2-year, 5-year, and 10-year all backed off late-March highs, yet Friday’s bounce showed the market is still very reluctant to price a rapid return to easy money.
Sources
- Federal Reserve Bank of St. Louis (FRED)
- 2-Year Treasury Constant Maturity Rate (DGS2)
- 5-Year Treasury Constant Maturity Rate (DGS5)
- 10-Year Treasury Constant Maturity Rate (DGS10)
https://fred.stlouisfed.org/
- U.S. Department of the Treasury
- Daily Treasury Yield Curve Rates (Constant Maturity Treasury)
https://home.treasury.gov/
- Daily Treasury Yield Curve Rates (Constant Maturity Treasury)
- Bureau of Labor Statistics
- Employment Situation Report (March 2026)
- Consumer Price Index Release Schedule
https://www.bls.gov/
- Federal Reserve
- FOMC Meeting Minutes and Calendar
https://www.federalreserve.gov/
- FOMC Meeting Minutes and Calendar
- U.S. Department of the Treasury
- Upcoming Treasury Auctions (3Y, 10Y, 30Y)
https://www.treasurydirect.gov/
- Upcoming Treasury Auctions (3Y, 10Y, 30Y)
- Reuters
- Coverage on U.S. labor market trends, manufacturing data, and Treasury market reactions
- Reporting on Middle East conflict and Strait of Hormuz developments
https://www.reuters.com/
- The Wall Street Journal
- Treasury market movements and investor positioning (March 30, 2026 market coverage)
https://www.wsj.com/
- Treasury market movements and investor positioning (March 30, 2026 market coverage)
- Barron’s
- Treasury yield movements tied to geopolitical developments
https://www.barrons.com/
- Treasury yield movements tied to geopolitical developments
This material has been distributed for informational purposes only and should not be considered as investment advice or a recommendation of any particular security, strategy or investment product. Information contained herein has been obtained from sources believed to be reliable, but not guaranteed. No part of this material may be reproduced in any form, or referred to in any other publication, without express written permission. ©2026 MIXED MARKET ARTIST
(Visit Fin Pro Marketing – The Best Marketing for Finance Professionals)

Billy Lee, CEO of Great White Financial, is a sportsman, businessman, artist, speaker, writer, and producer.
Billy is the Founder of the Wellness Institute for Economic Growth and Kairos Athletics.