
Treasury market recap: 2-year, 5-year, and 10-year yields jumped as oil shock, inflation nerves, and Fed repricing drove a broad selloff
U.S. Treasury yields moved sharply higher this past week, with the move concentrated in the front and intermediate parts of the curve but extending all the way out to 30 years. Using the Treasury’s daily par yield curve data, the 2-year yield rose from 3.56% on March 9 to 3.73% on March 13, the 5-year rose from 3.71% to 3.87%, and the 10-year rose from 4.12% to 4.28%. That means the 2-year climbed 17 basis points, while the 5-year and 10-year each rose 16 basis points over the week.
The big picture is that Treasuries spent the week trading less like a pure safe haven and more like an inflation-sensitive asset. The market’s working assumption was that the war-related oil shock could keep inflation hotter for longer, even if growth data softened. Reuters reported that Brent crude had surged as the conflict with Iran disrupted energy flows and raised fears of prolonged supply damage, while by Friday oil was again above $100 a barrel as the war kept pressure on energy markets and on Fed expectations.
What happened to the 2-year, 5-year, and 10-year this week
2-year, 5-year, and 10-year yields through the week
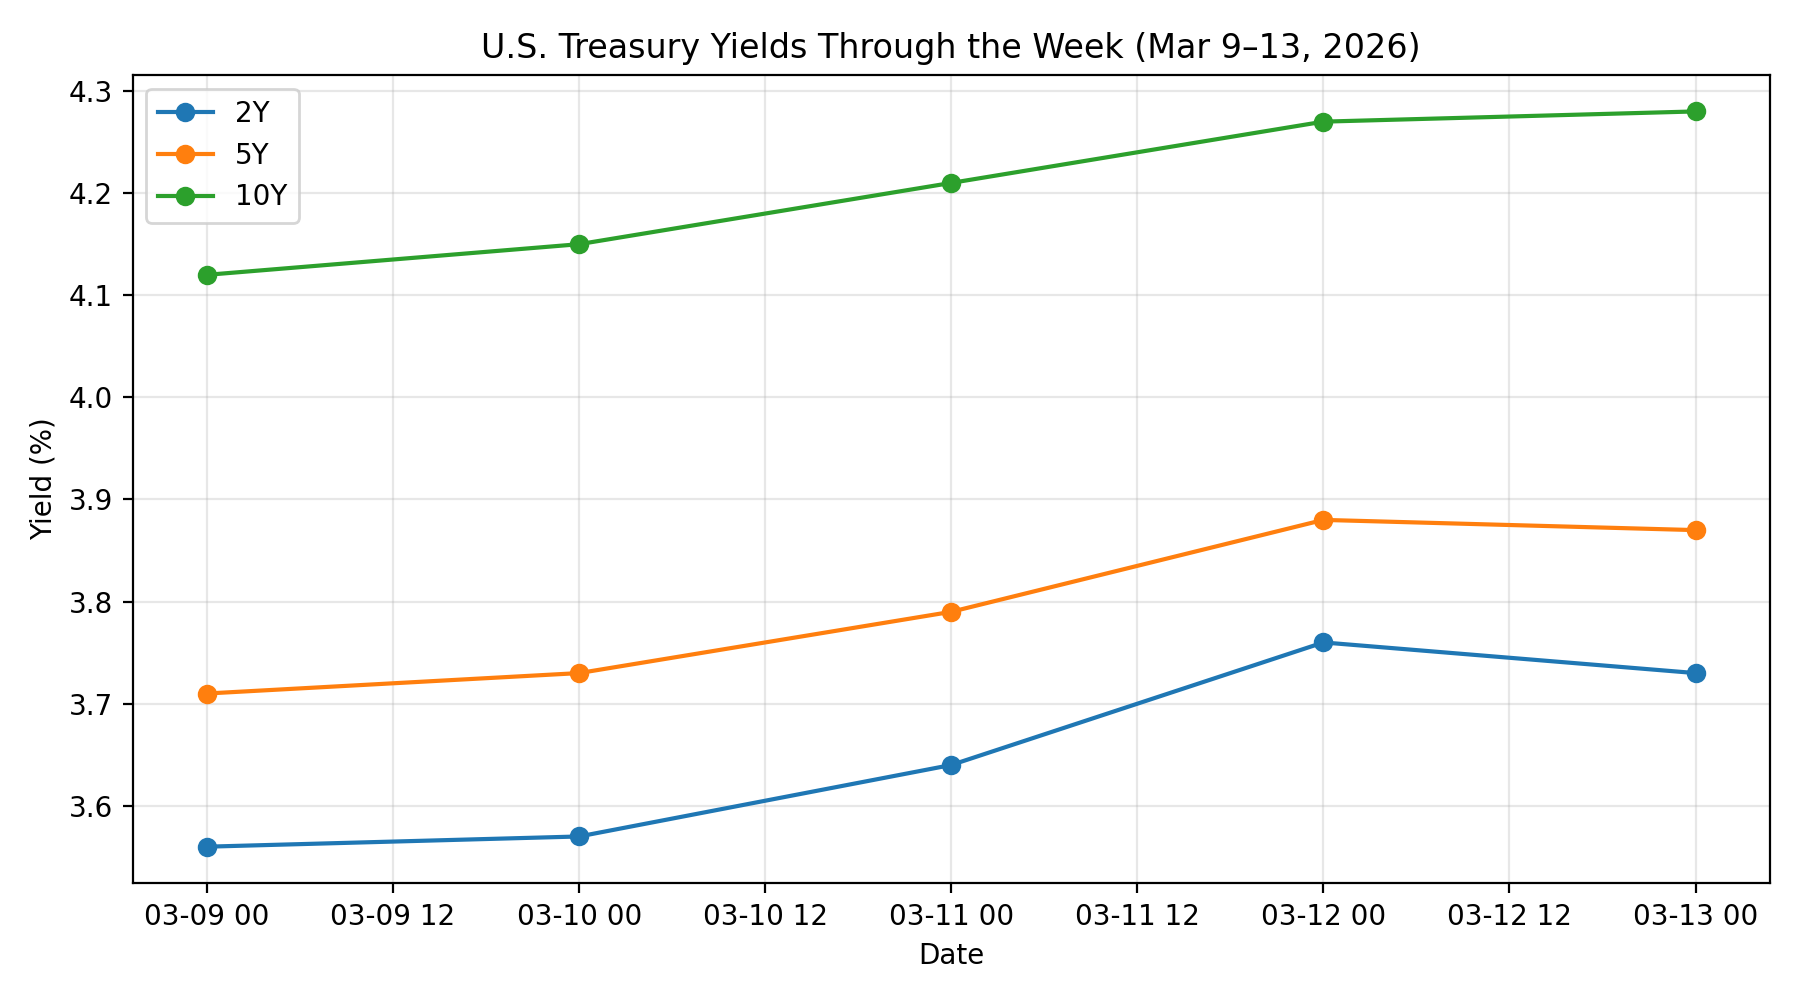
The 2-year was the clearest signal that markets were repricing the expected path of Fed policy. It was at 3.56% on both Monday and Tuesday, then jumped to 3.64% on Wednesday, surged again to 3.76% on Thursday, and ended Friday only slightly lower at 3.73%. The 5-year moved from 3.71% on Monday to 3.87% by Friday, and the 10-year climbed from 4.12% to 4.28% over the same span. The fact that the selloff was broad and persistent tells you this was not a one-data-point reaction. It was a repricing of inflation risk, rate-cut timing, and term premium all at once.
Tuesday was the temporary pause. Oil collapsed more than 11% after President Trump signaled possible de-escalation in the Middle East, and that briefly eased inflation concerns. By Reuters’ account, the sudden drop reflected hopes that shipping through Hormuz would normalize and that emergency reserve releases could calm the market. That cooling in oil likely helped keep Treasury yields from rising further on March 10.
But that relief did not last. By Wednesday and Thursday, the Treasury market was selling off again as investors concluded that even if headline inflation data was not disastrous, the underlying setup for the next few months had become more inflationary because of war-driven energy costs. Reuters noted that on Wednesday the benchmark 10-year yield jumped about 9 basis points to roughly 4.226%, with rising oil and gas prices adding to fears of overheating and making investors doubt near-term Fed cuts.
The economic numbers that mattered
Wednesday’s CPI report was not a clean bearish surprise by itself, but it did not rescue the bond market either. The BLS reported that headline CPI rose 0.3% month over month in February and 2.4% year over year, while core CPI rose 2.5% year over year. Reuters described the report as broadly in line with expectations, but emphasized that markets were already looking past February and focusing on how the Iran war and the energy shock could lift inflation in March and beyond.
Friday’s PCE-related data was more nuanced. The BEA reported that January personal income rose 0.4%, disposable personal income rose 0.9%, and personal consumption expenditures rose 0.4%. Reuters added that the PCE price index rose 0.3% month over month and 2.8% year over year, while core PCE rose 3.1% year over year, its highest annual rate since March 2024. That report was softer than some of the bond market had feared at the margin, and traders moved back toward pricing the next Fed cut in September rather than October.
Other data during the week reinforced the “stagflation risk” discussion rather than resolving it. Reuters reported that weekly jobless claims fell to 213,000, showing layoffs remain low, but single-family housing starts fell 2.8% in January and permits also softened. On Friday, the University of Michigan’s preliminary March consumer sentiment index fell to 55.5 from 56.6 in February as higher gasoline prices hit household confidence. That combination, soft confidence but not-yet-broken labor markets, is one reason Treasuries did not get much relief.
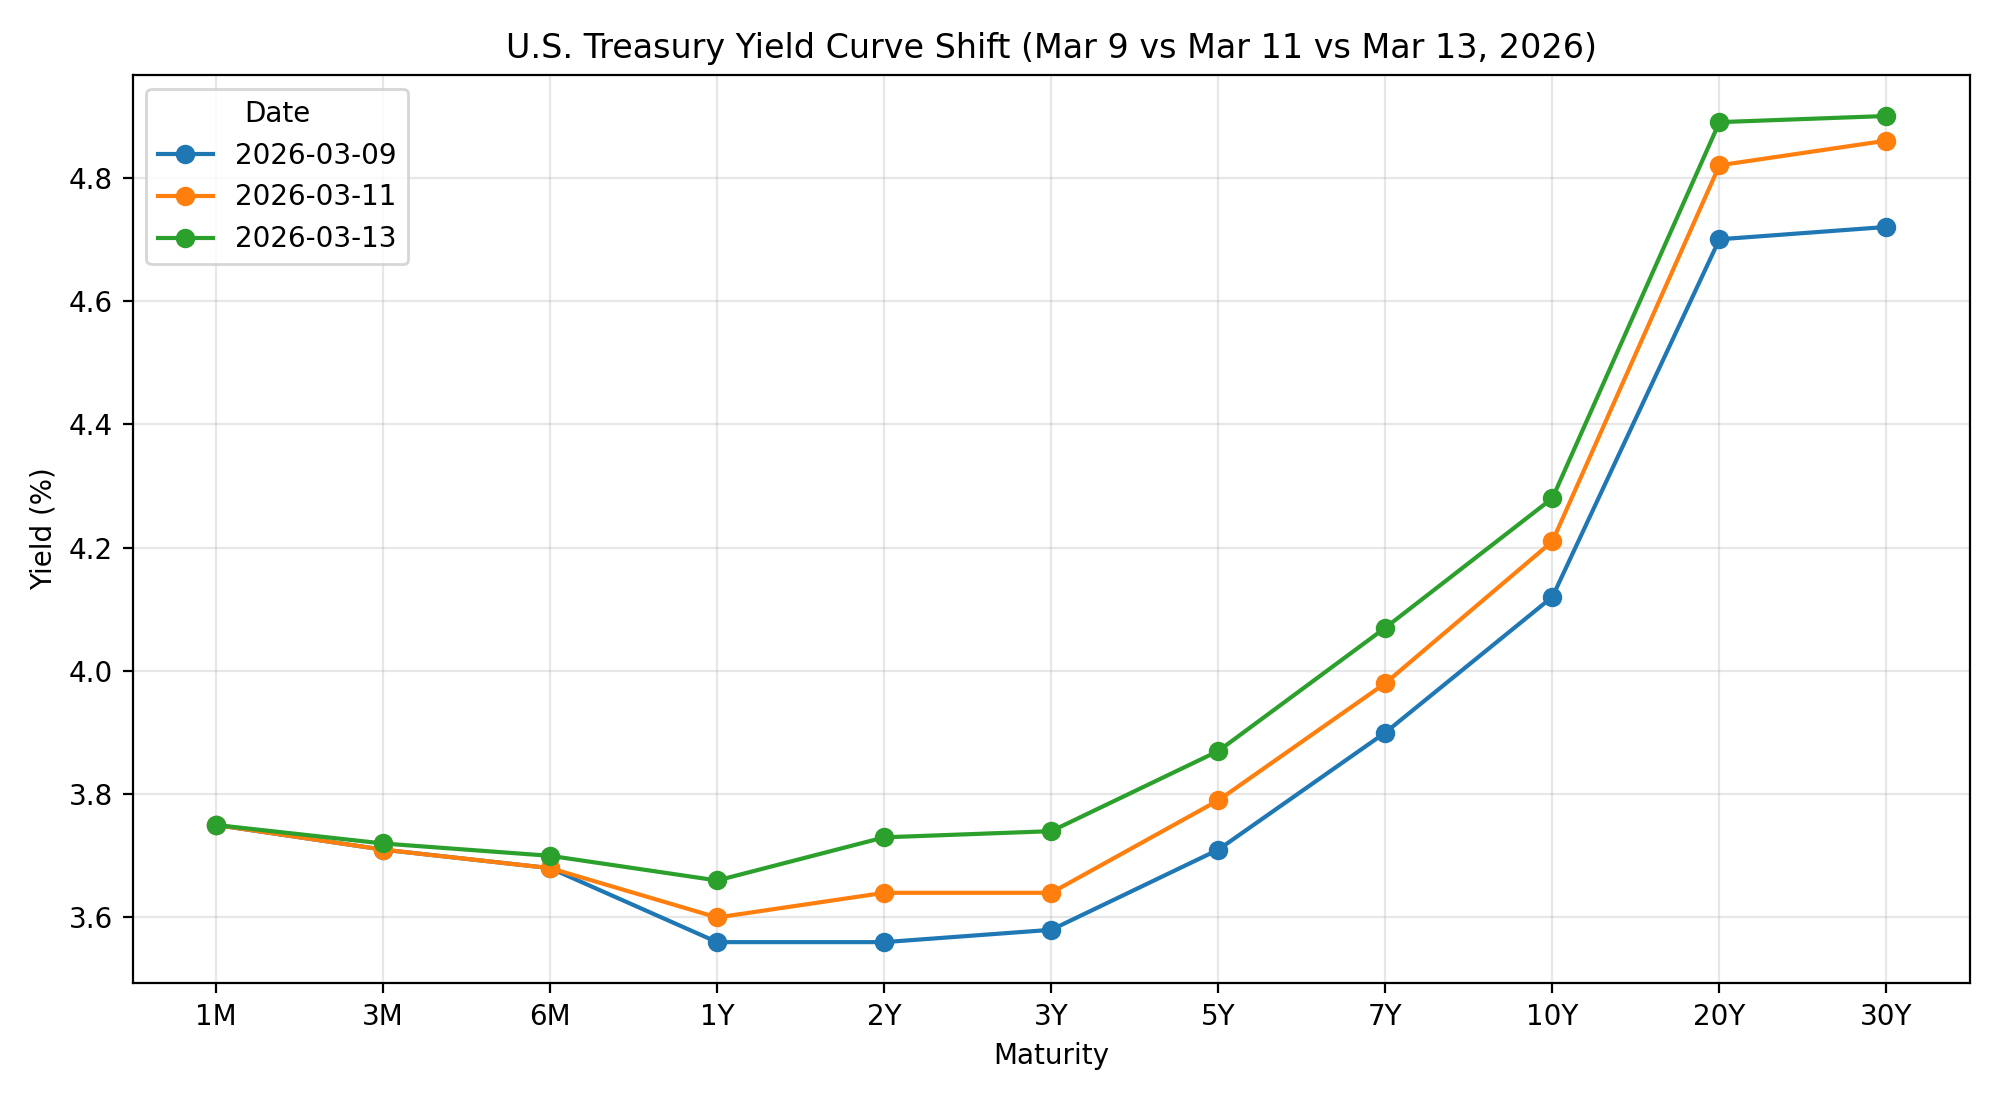
Yield curve shift over the week
Why yields rose even though some of the data softened
The answer is that this week was dominated by forward inflation risk, not backward-looking disinflation. February CPI was viewed as stale almost immediately because it predates much of the war-related energy move. Reuters noted that strategists have been pushing back their first Fed-cut forecasts because the conflict has increased the odds that oil-driven inflation lingers longer than previously expected. Barclays now expects its first cut in September instead of June, while Goldman also pushed back its easing call.
There was also a market-structure element. A soft 10-year auction on Wednesday added pressure to Treasuries by signaling weaker demand just as inflation worries were intensifying. That matters because when supply meets a market already nervous about inflation, yields can overshoot quickly.
So the week’s message from rates was pretty clear: the Treasury market is increasingly worried that the Fed could be stuck between weaker growth and another inflation pulse. That is why the 2-year rose sharply, reflecting a pushout in rate-cut expectations, while the 10-year also rose sharply, reflecting higher inflation risk and a higher term premium. Reuters’ poll of bond strategists captured that tension well: many still expect lower 2-year yields in coming months, but they also expect the 10-year to remain elevated because of inflation, supply, and fiscal concerns.
What could move Treasury yields this coming week
The most important event on the calendar is the Federal Reserve’s March 17–18 meeting, with the policy statement and press conference on Wednesday, March 18. The Federal Reserve’s official calendar shows that this is one of the meetings tied to a Summary of Economic Projections, which means markets will care not just about the rate decision, but also about the new dot plot, the inflation forecast, and how Chair Powell frames the oil shock and the balance between inflation and growth risks.
The market overwhelmingly expects the Fed to hold rates steady, but the communication risk is high. Reuters and other market coverage indicate that investors are now much more sensitive to any hint that policymakers may need to stay restrictive longer because of energy-driven inflation. If Powell sounds more worried about inflation persistence than labor-market weakening, the 2-year and 5-year could move higher again. If he sounds more focused on downside growth risks, yields could retrace part of this week’s selloff.
Outside the Fed, the official calendar shows industrial production on Monday, March 16 from the Federal Reserve. Census also shows that new residential construction data remains in flux after prior shutdown-related disruptions, with February housing starts still effectively to be announced on the release calendar. Notably, the Census retail-sales release schedule still lists upcoming months as to be announced, so retail sales is not a clean scheduled catalyst in the way it normally would be.
And then there is the obvious non-calendar risk: the war itself. Reuters reported today that the conflict has intensified further, with oil infrastructure under threat and the Strait of Hormuz still a major market concern. If oil pushes materially higher again, the Treasury market may continue to treat geopolitics as an inflation story first and a growth scare second.
Bottom line
This past week, the Treasury market repriced toward a tougher Fed and a more inflationary near-term outlook. The 2-year, 5-year, and 10-year all rose sharply, not because growth data was strong, but because investors became less confident that soft growth will be enough to deliver quick rate cuts if oil and inflation expectations keep climbing. This week’s FOMC meeting is now the key test: if the Fed validates the market’s inflation concerns, yields can stay high or move higher. If Powell leans harder into growth risks and treats the oil shock as temporary, Treasuries may finally get some relief.
Sources and Research References
Interest Rate Data
U.S. Department of the Treasury
Daily Treasury Par Yield Curve Rates
https://home.treasury.gov/resource-center/data-chart-center/interest-rates/TextView?type=daily_treasury_yield_curve
TreasuryDirect
U.S. Treasury Auction Calendar
https://www.treasurydirect.gov/auctions/upcoming/
Economic Data
U.S. Bureau of Labor Statistics
Consumer Price Index (CPI) Report
https://www.bls.gov/news.release/cpi.htm
U.S. Bureau of Labor Statistics
Employment Situation Report (Nonfarm Payrolls)
https://www.bls.gov/news.release/empsit.htm
U.S. Bureau of Economic Analysis
Personal Income and Outlays / PCE Inflation
https://www.bea.gov/news/2026/personal-income-and-outlays
Federal Reserve
Industrial Production and Capacity Utilization (G.17)
https://www.federalreserve.gov/releases/g17/
U.S. Census Bureau
New Residential Construction (Housing Starts)
https://www.census.gov/construction/nrc/index.html
University of Michigan
Consumer Sentiment Survey
https://data.sca.isr.umich.edu
Federal Reserve Policy
Federal Reserve
FOMC Meeting Calendar and Policy Announcements
https://www.federalreserve.gov/monetarypolicy/fomccalendars.htm
Market and Geopolitical Reporting
Reuters
Global Markets Coverage
https://www.reuters.com/markets/
Reuters
Energy Market Coverage and Oil Price Developments
https://www.reuters.com/business/energy/
Reuters
U.S. Treasury Market and Interest Rate Coverage
https://www.reuters.com/markets/us/
Additional Market Data
Federal Reserve Economic Data (FRED)
https://fred.stlouisfed.org
This material has been distributed for informational purposes only and should not be considered as investment advice or a recommendation of any particular security, strategy or investment product. Information contained herein has been obtained from sources believed to be reliable, but not guaranteed. No part of this material may be reproduced in any form, or referred to in any other publication, without express written permission. ©2026 MIXED MARKET ARTIST
(Visit Fin Pro Marketing – The Best Marketing for Finance Professionals)

Billy Lee, CEO of Great White Financial, is a sportsman, businessman, artist, speaker, writer, and producer.
Billy is the Founder of the Wellness Institute for Economic Growth and Kairos Athletics.