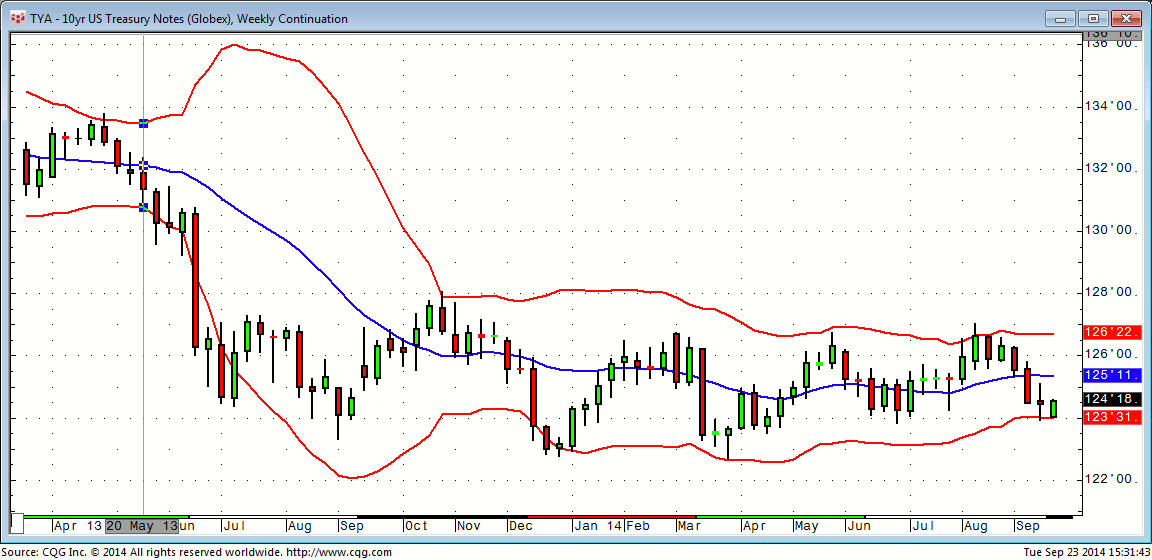
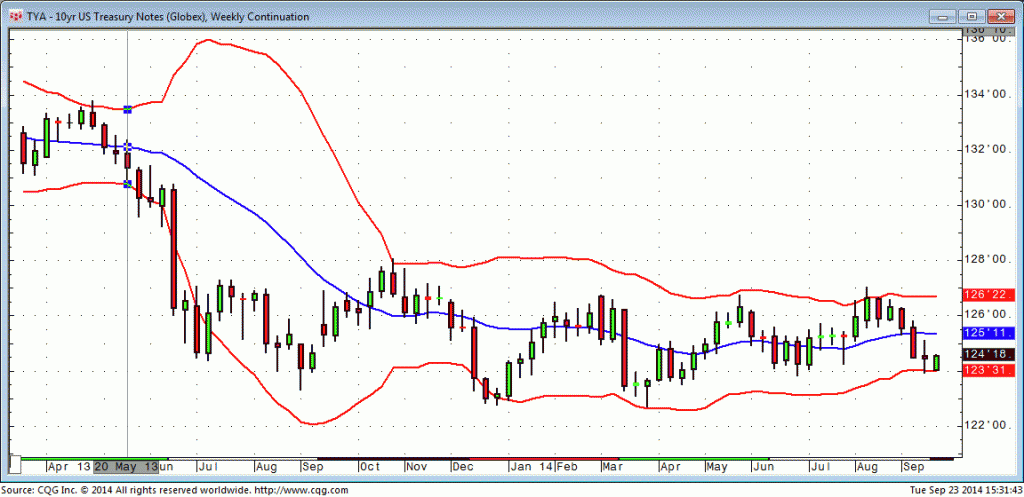
Take a look at price action in the Ten Year Futures contract on this weekly chart. As the contract rallies throughout May and into June observe how the Bollinger Bands tend to steadily converge. The bands have basically continued to converge to the present week. This indicates how volatility has waned throughout the summer. Yesterday’s chart of the ten year also shows us how little volatility we have see in the ten year market.
Considering yesterday’s analysis of the ten year on the daily chart, it seems that if we see a couple weeks of price consolidation at this level, then we are likely to move higher. Failure to find price support at this level over the ensuing weeks could seem a harbinger to a sell-off.
Note: The upper and lower bands are respectively calculated by adding and subtracting a variable multiplied by a standard deviation parameter (learn more about Bollinger Bands). Thus, as volatility increases the value of the upper band increases, and the value of the lower bound decreases.


