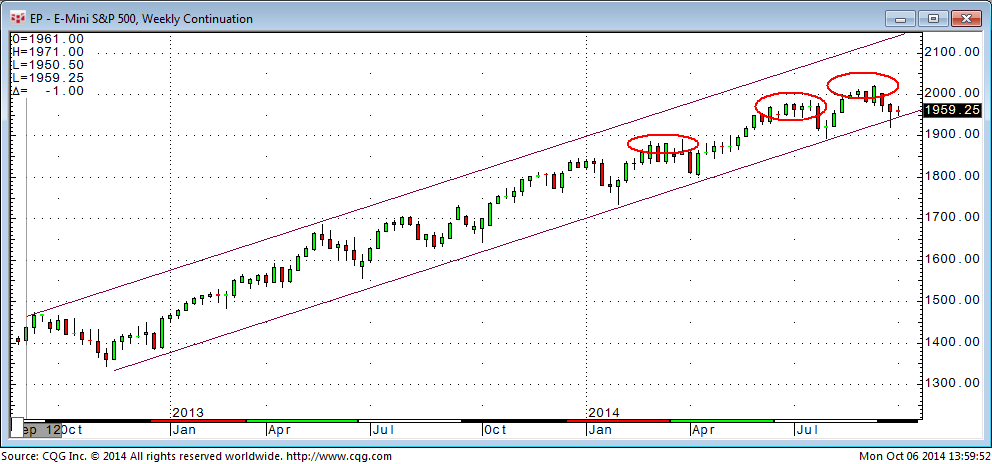
Take a look at the trend channel and the ellipses drawn into the weekly chart of the Standard and Poor 500 futures chart. The rally of 2013 pictured in the chart sure does appear very persistent and orderly! (Easy money policy works?)
Failing to rally this week will bring us closer to penetrating the bottom trend-line at 1950.50. Obviously, breaking below that level this week appears very significant on this chart.
Also, notice the lower highs between the second and third ellipses. This loss of momentum combined with a violation of the trend-line is what we have not seen in almost two years.
One response